
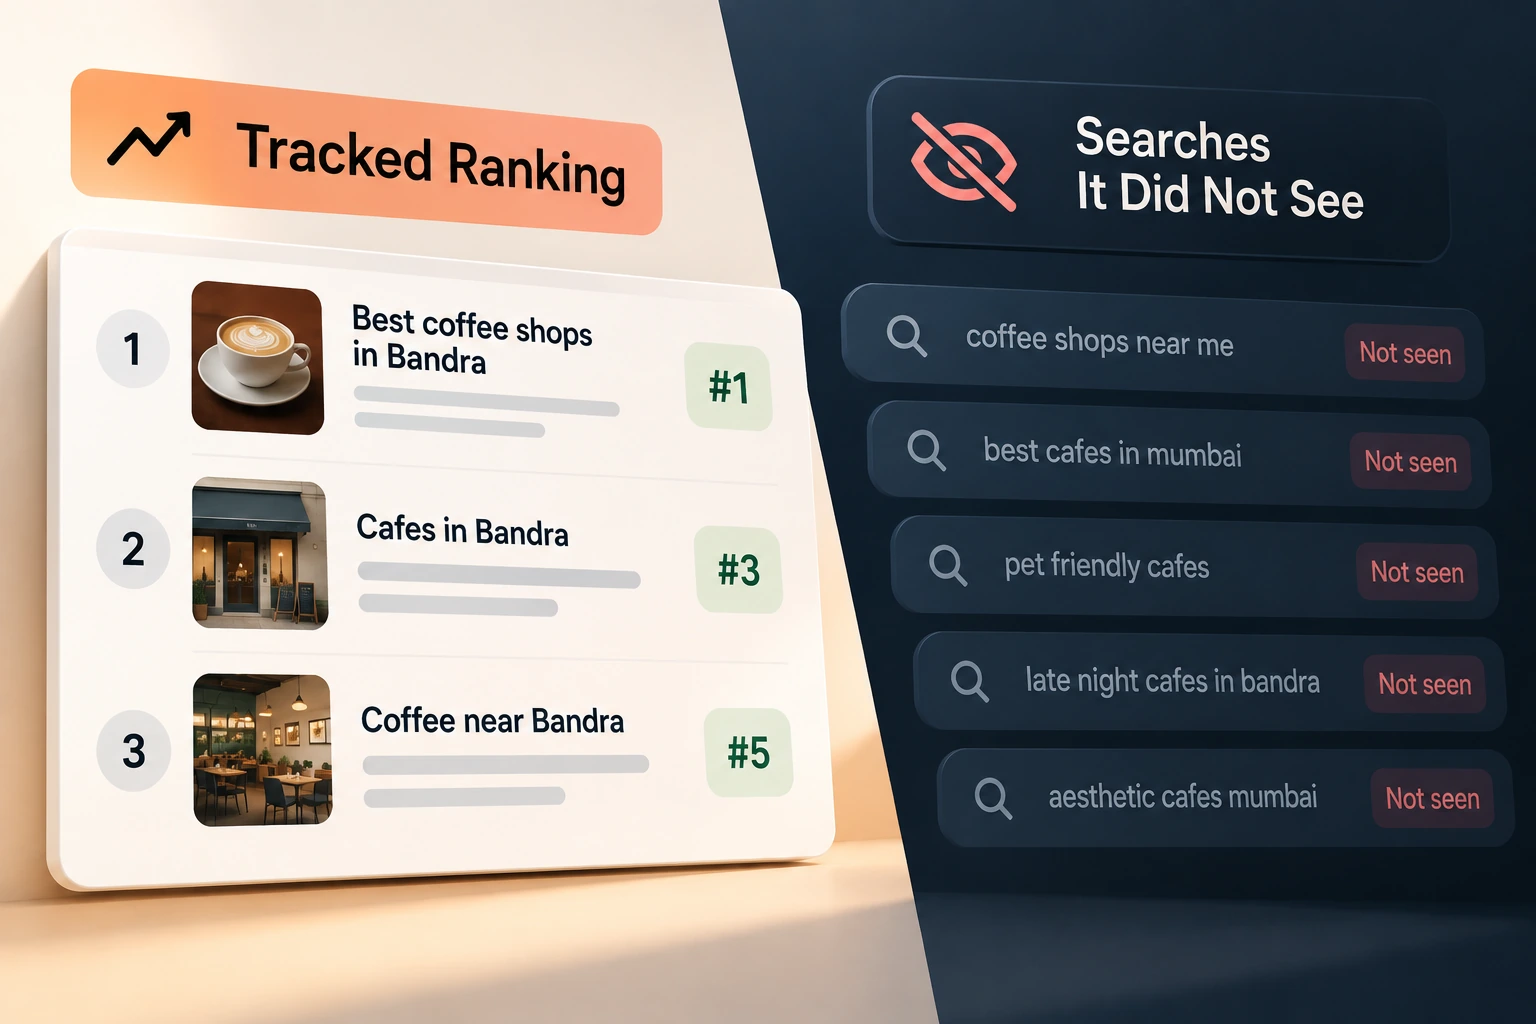
Search results are personalised, localised and assembled per query, so a rank tracker fixes a location and a device and reports a simulation of one search. Search Console’s average position is the average of the highest position reached across impressions, and it worsens when a site begins appearing for harder queries. The number almost nobody reports — how many distinct queries a site receives impressions for — is free, cannot be bought, and moves months before clicks do.
Every month a document arrives with a table of keywords and positions. Some green arrows, some red. It is the most common SEO deliverable sold in India and it is measuring something that no longer exists in the form the table implies.
Search results are personalised, localised, device-dependent and assembled per query. Two people in the same office searching the same phrase can see different pages in a different order.
So a rank tracker cannot measure your position. What it does is fix a location, fix a device, run a query without a search history, and report what came back. That is a simulation of one search. Useful for spotting large movements. Not a measurement, and not a number that should sit at the top of a report to a business owner.
Our SEO strategy page argues about what constrains a site. This is the companion problem: what you look at while you find out whether any of it worked.
Average position is not a score either
The usual upgrade is to abandon rank trackers for Search Console, which is a genuine improvement — the data is Google’s own and reflects real searches by real people.
But average position gets misread almost universally.
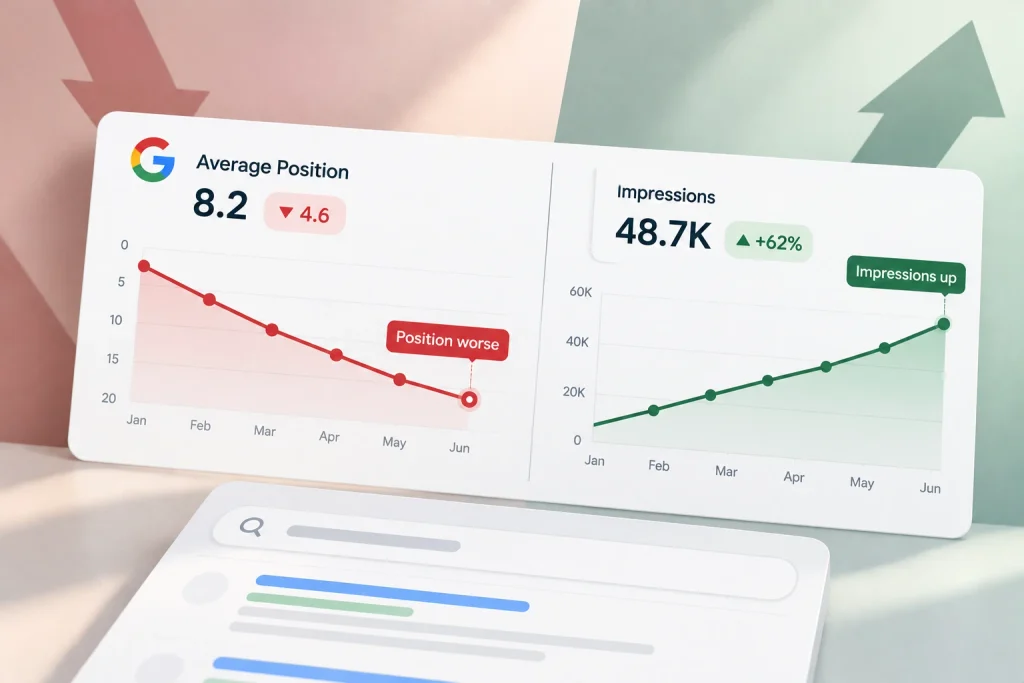
It is the average of the highest position your page reached, across every impression recorded for that query. Which means it moves for reasons that have nothing to do with your work.
Start appearing for a harder query and your average worsens, because you have added impressions at position thirty to a set that previously only contained position eight. The number went down and the site improved. Reported as a monthly score to somebody who is not going to read a definition, it produces the opposite conversation to the one that should happen.
Watch it alongside impressions, or do not watch it at all.
The metric nobody reports
Here is the one worth adding, and it costs nothing.
In Search Console, over a fixed window, count the number of distinct queries your site received impressions for. Not clicks. Not position. How many different things people searched where Google decided to show you.
That number is the earliest honest evidence that Google has worked out what your site is about. It moves months before clicks do, because appearing at position forty for two hundred new queries generates no traffic at all while representing real progress.
It is also difficult to fake, which is more than can be said for most agency metrics. Nobody can buy query count.
Track it monthly from the start. A site whose query count climbs steadily is being understood. A site whose query count is flat after six months of publishing has a problem worth finding, and the first place to look is whether the pages are in the index at all — which is a specific status we have written about in pages Google read and declined to keep.
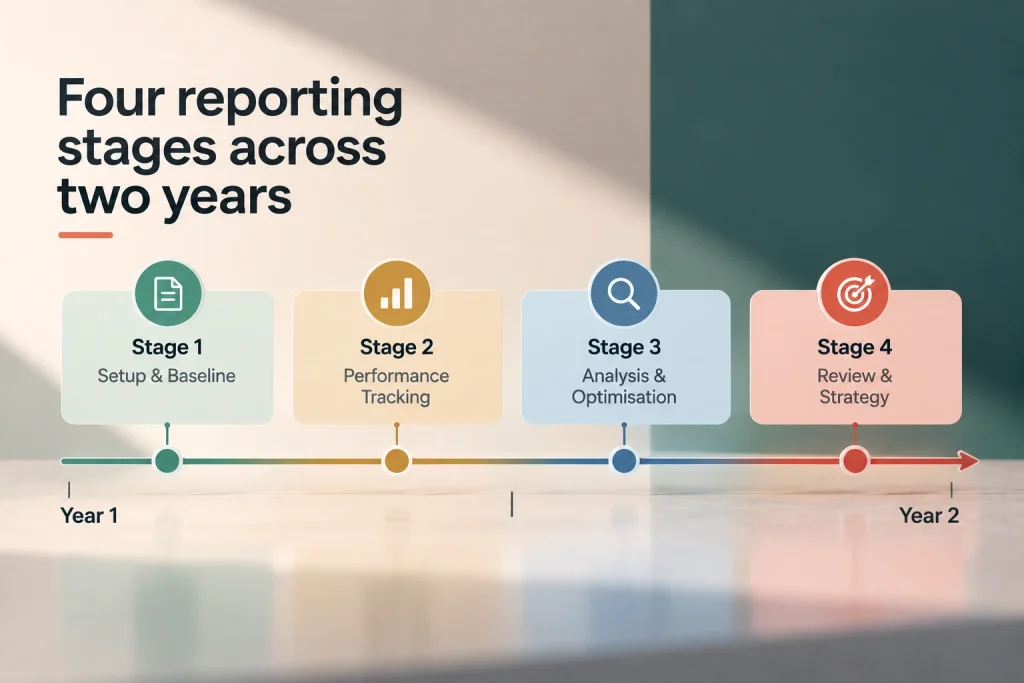
Stage one, months zero to three: is it in the index

For the first quarter, almost nothing can move. Accepting that is the difference between a report that is useful and a report that invents progress.
The only honest number in this period is coverage. How many of the pages you published are actually in Google’s index, and how many are sitting excluded.
It is binary, it is checkable in a few minutes, and it is the one thing that will absolutely stop everything else if it goes wrong. A business publishing into a partial index is spending money on pages that do not exist.
Report that. Then say plainly that the rest is too early.
Stage two, months three to nine: impressions and query count
Now the two numbers that matter are impressions and distinct queries, and neither is about traffic.
Impressions tell you Google is showing you. Query count tells you it is showing you for an expanding set of things. Together they describe whether your subject coverage is registering, and they will both move well before clicks do.
Clicks in this window are a distraction. Appearing at position twenty-two produces almost none, and reading that as failure has killed a great many programmes at exactly the point they were starting to work.
If impressions rise and query count is flat, you are getting deeper on the same small set of topics. If query count rises and impressions are flat, you are getting broader but shallow. Both are readable, and neither is visible in a rankings table.
Stage three, months six to eighteen: clicks, split
Once clicks arrive, split them. Branded queries — people searching your company name — and everything else.
Most Indian SEO reports never separate these, which allows a rise in branded search to be presented as SEO performance when it was produced by an advertising campaign, a PR mention or a founder’s LinkedIn activity.
Non-branded clicks are the number that belongs to the search work. That is your line.
Branded search volume is worth watching separately as a demand signal, and our article on performance marketing for B2B covers why it is the cleanest available proxy for demand you created but cannot trace.
Stage four, twelve months and beyond: enquiries, reconciled
Eventually the question is commercial, and here the honest answer is unsatisfying.
SEO attribution is worse than paid attribution and cannot be fixed by better software. The path from a search someone ran in March to an enquiry in July is not recorded anywhere in full. Analytics will show you a last click that was probably direct.
What works is asking. The enquiry form field that asks how someone found you produces messy, incomplete, and more accurate data than the analytics platform does — an argument our B2B article makes at length and which we will not repeat here.
Then reconcile against your own sales records rather than any platform’s report. And accept a range instead of a figure. A business that knows search contributed somewhere between fifteen and thirty per cent of enquiries last year knows more than one holding a precise number that is wrong.
“How long before it works” has two answers
The question gets asked as one question and it is two, which is why the answers people get are unsatisfying.
Is it working and has it paid are separated by more than a year.
You can tell whether it is working reasonably early. If coverage is clean by month two and query count is climbing by month four or five, the machinery is functioning. That is not traffic and it is not revenue, and it is a real answer to a real question.
Whether it paid is a different matter, and it depends on your sales cycle rather than on search. A business with a two-week cycle and a business with a nine-month cycle running identical SEO work will reach that answer at very different times, and the search work has nothing to do with the difference.
So the useful commitment is not a date for results. It is a date for each stage’s evidence: coverage at eight weeks, query count trend at four months, non-branded clicks at nine, reconciled enquiries at eighteen. If a stage fails to arrive, you have found something, and you found it long before the year was up.
While we are here: there is no good average position, and anyone who asks what one looks like has been handed the metric as a score. The number only means something next to impressions.
What the report should actually contain
One page. Four blocks.
What was done. Published, fixed, merged, pitched. Dated, specific, checkable. This is the monthly part and it is the only part that is monthly.
Coverage. Pages published, pages indexed, pages excluded, and any change since last month. Two lines.
The stage metric. Whichever one applies, with the previous three months beside it so the direction is visible. One chart, not five.
What we learned and what changes. Two or three sentences of actual judgement. Which query is closer than expected, which page is not going to work, what we are stopping.
That last block is the one that gets left out, and it is the only part a business owner should really care about. A report that contains numbers and no decisions is a status update wearing a suit.
Three things to stop reporting
Keyword rankings, for the reason this article opens with. Keep a small tracked set for movement detection if you like. Do not put it on page one.
Domain authority scores. These are vendor metrics, invented by tool companies, computed from their own link indexes. Google does not publish one and does not use theirs. If you want a link-side number, count the referring domains behind the pages that beat you — a method we set out in our article on link building.
Total traffic. It includes bots, your own team, and direct visits from people who already knew you. It is the number most likely to be quoted in a pitch and least likely to mean anything.
Report monthly on activity, quarterly on outcome
One more thing that would improve most retainers immediately.
Search results move on a slower cycle than a monthly meeting. Reporting outcomes every thirty days means reporting noise, and reporting noise means responding to noise — changing a page that was fine, abandoning a query that was two months from working.
Report activity monthly: what was published, what was fixed, what was pitched. Report outcome quarterly, against the stage-appropriate metric.
And when two of your own pages start competing for the same query, that shows up here first — a check worth building into the quarterly review, and one we describe in finding the version you already have.
Final thoughts
The rankings table survives because it is easy to produce, easy to read and moves every month, which makes it the perfect thing to sell and a poor thing to manage by.
Replace it with coverage, then impressions and query count, then non-branded clicks, then reconciled enquiries. Each one at the stage where it can actually move.
If your report has looked the same since month one, you can reach out to us on whatsapp at +91 7738844851 and we will tell you which numbers on it are doing any work.
More in Blog
Keep reading
All articles →


Ready to talk about your growth?
Tell us what's stuck and we'll tell you what we'd do first. Free, 30 minutes, no pitch.