
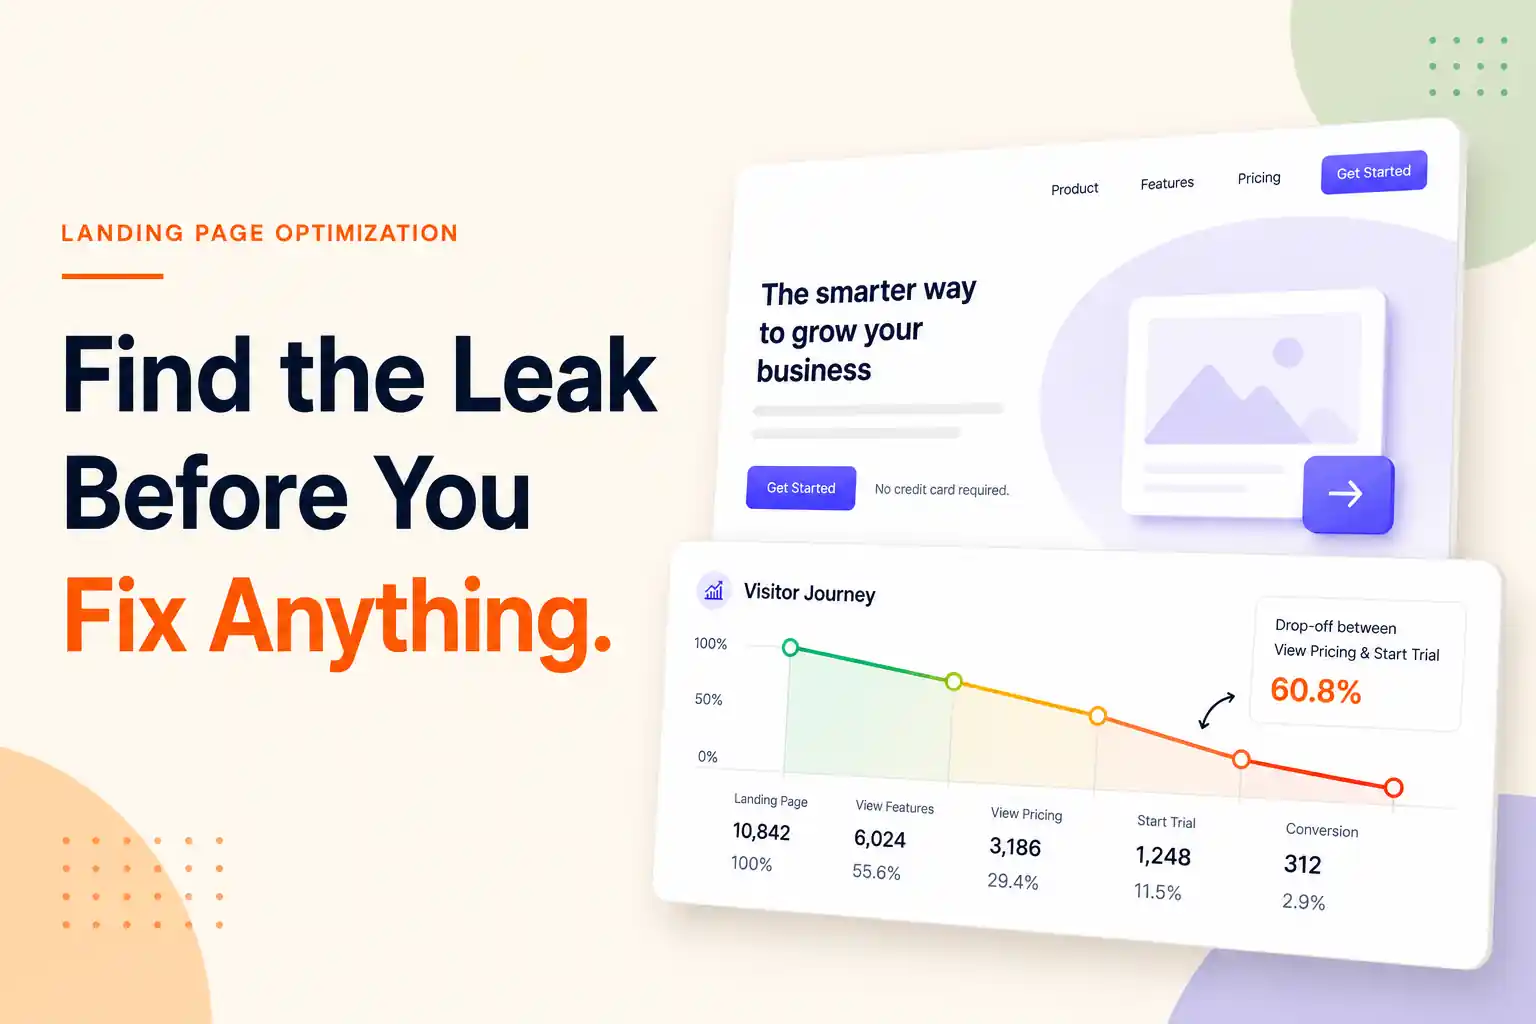
Most advice on this subject arrives as an unordered list. Twenty items, all presented as equally important: shorten your headline, add testimonials, reduce form fields, improve your call to action, use contrasting colours.
Work through it and you will fix several things that were never broken, while the actual fault sits upstream, untouched.
Some problems mask others. A page nobody can load has no copy problem. A page whose tracking is broken has no measurable problem at all. Order matters more than completeness.
The short answer
Diagnose before you change anything, and check in an order that respects dependency: measurement first, then rendering, then whether the page matches the ad that sent people there, then whether the action can be completed, then whether the obvious objection is answered — and only then copy and design. Separately, work out whether you have enough traffic to A/B test. Most pages do not, and below that threshold the discipline is diagnosis rather than experimentation.
Key takeaways
- Check in order. Upstream faults hide downstream ones and make measurement meaningless.
- A page at 3% conversion needs roughly 13,900 visitors per variant to detect a 20% improvement at conventional confidence. Most pages cannot test.
- At 500 visitors a month, one test takes over four years. At 5,000, nearly six months.
- Below testing volume, use small-sample diagnosis — session recordings, form analytics, five users talking through the page.
- Message match between ad and page is the highest-return single fix and the most commonly missed.
The Traffic Line
Before any of the diagnostic work, one calculation decides which method is available to you.
A/B testing requires statistical power, and power requires traffic. The arithmetic is not a matter of opinion.
Take a page converting at 3% — reasonable for a B2B landing page. To detect a 20% relative improvement, meaning a lift from 3% to 3.6%, at 95% confidence and 80% power, you need approximately 13,900 visitors per variant. About 27,800 in total.
Now put real traffic against that.
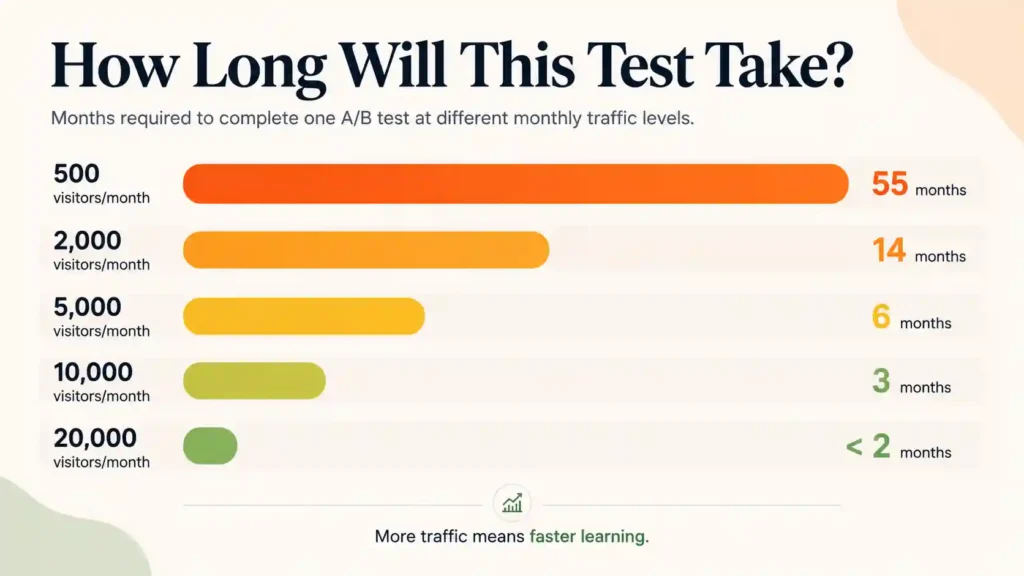
At 500 visitors a month, that single test takes roughly 55 months. Over four years.
At 2,000 a month, about 14 months.
At 5,000 a month, about 5.6 months.
At 20,000 a month, under two months — and only here does iterative testing become a working practice.
Two things follow.
If your page has fewer than a few thousand visitors a month, A/B testing is not available to you at any level of discipline. Running tests anyway produces results that look like findings and are noise, which is worse than not testing, because you will act on them.
And a test that takes five months is not a test. Seasonality, traffic mix and market conditions all move within it.
Larger effects need less traffic. The same 3% page detecting a 50% improvement needs roughly 2,500 per variant rather than 13,900. Which is a useful reframing: below the traffic line, only look for large changes, and do not expect to prove them statistically.
The Leak Order
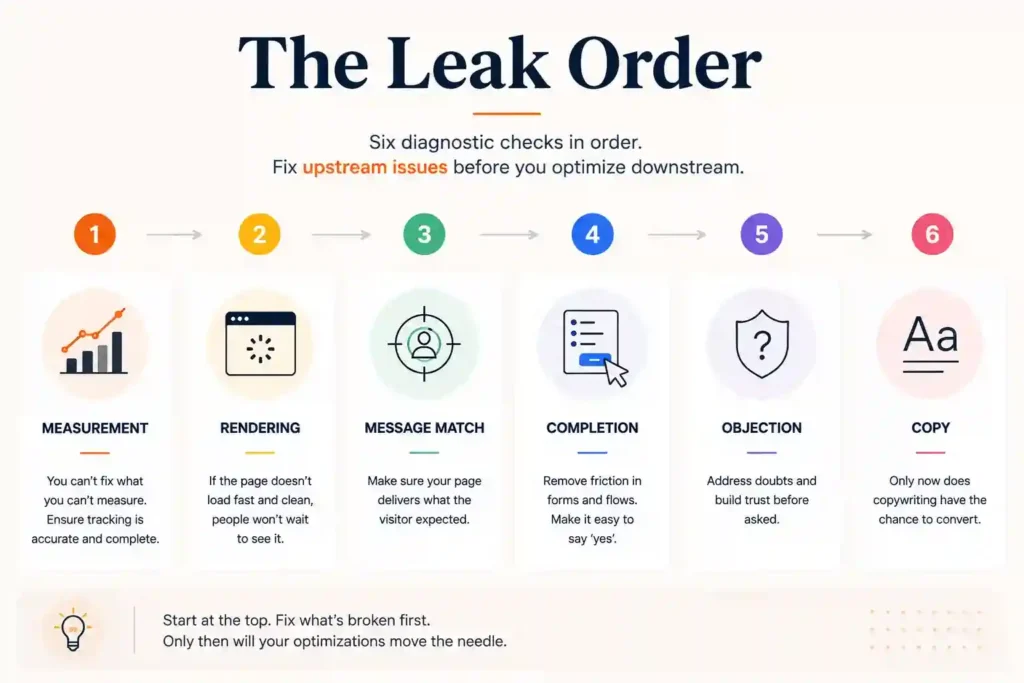
Check in dependency order, because upstream faults conceal everything beneath them. A page with broken tracking cannot be judged. A page that does not render cannot be read. Copy is the sixth thing to examine, not the first.
1. Is it measured correctly?
Everything downstream is fiction until this is settled.
Confirm the conversion fires, once, on the real completion event — not on page load, not on button click before submission succeeds.
Reconcile against reality. Count actual enquiries in your inbox or CRM for a week and compare against what analytics reports. A gap means one of the two is wrong and you need to know which before interpreting any rate.
Check the traffic figure separately. Bot traffic, internal visits and duplicate tags all inflate the denominator, which deflates the conversion rate and sends you optimising a page that was working.
2. Does it render, quickly, on the devices people use?
Check on a real mid-range Android phone on mobile data, not on your laptop on office wifi. That is what most Indian traffic actually is.
Measure Largest Contentful Paint. Google’s threshold for a good experience is 2.5 seconds. PageSpeed Insights reports it against real-world data where available.
On speed statistics. The widely repeated claim that one additional second costs 7% of conversions traces to Aberdeen Group research from 2008 — older than most phones now in use, and repeated ever since without re-testing. Speed matters and the direction is well established; treat the specific percentage as folklore rather than evidence.
Check what renders above the fold. If the headline and the action are below the first screen on a phone, you have a layout problem masquerading as a copy problem.
3. Does it match what the ad promised?
The single highest-return check, and the most commonly failed.
Open your ad, read it, then open the landing page. If the ad promised a price, the page should show pricing. If the ad named a specific service, that service should be the headline — not your general proposition.
Where this breaks most often. Traffic from a specific ad group arriving at a homepage or a general services page. The visitor has to re-find what they were promised, and most will not.
Why it outranks copy quality. A perfectly written page about the wrong thing converts worse than a plain page about the right thing.
4. Can the action actually be completed?
Try it yourself on a phone, as a stranger would.
Watch for the specific failures. Fields that reject valid Indian phone numbers. Required fields with no obvious purpose. Error messages that clear the whole form. A submit button that gives no feedback so people press it twice. Date pickers that fight mobile keyboards.
Field count matters, though the published figures vary. Reported guidance suggests each additional field costs conversion, with three to four fields commonly cited as a working range for B2B. Those figures circulate without consistent methodology; treat the direction as sound and the numbers as indicative.
The counter-consideration. Fewer fields means more volume and less qualification. Which trade suits you depends on your sales capacity — the same tension covered in why frictionless forms produce unqualified leads.
5. Is the obvious objection answered?
By this point the page works and matches. Now ask what stops a genuinely interested person.
Price, or its absence. A page with no price signal loses people who assume they cannot afford it and attracts people who cannot. Stating a range filters both ways.
Trust for an unfamiliar company. Real address, real names, real client work, GST details where relevant. For an Indian buyer evaluating an unknown supplier, these carry weight.
Proof that is specific. “Trusted by 200+ clients” proves nothing. One named client with a described outcome proves more than a wall of logos.
What happens next. People hesitate when they do not know what submitting means. “We reply within one working day” removes a real objection at no cost.
6. Only now: copy, design and layout
Headline sharpness, subheading clarity, button wording, visual hierarchy, image choice.
These matter. They are also the sixth thing to examine, and the reason most optimisation efforts underperform is that they start here — where the work is visible and pleasant — rather than at measurement, where it is not.
Once diagnosis points you at this layer, the 21-point checklist we use on Indian client pages is the prescriptive companion to this article.
What to do below the traffic line
Most readers will be here, and it is a legitimate discipline rather than a consolation.
Session recordings. Watch twenty real sessions. You will see people scroll past the form, hesitate at a field, or leave at a specific point. Twenty sessions is not statistically significant and does not need to be — you are looking for obvious failures, not marginal gains.
Form analytics. Which field people abandon on. This is the highest-yield small-sample data available and most businesses have never looked at it.
Five users, thinking aloud. Nielsen Norman Group’s long-standing finding is that a small number of users reveals most usability problems. Five people who match your buyer, asked to complete the action while narrating, will find things no amount of internal review does.
Ask customers who converted. What nearly stopped them. People answer this honestly and it costs one question on a call.
Make large, confident changes rather than small ones. Below the traffic line you cannot detect a 5% improvement, so do not spend effort on changes that size. Change the offer, the headline, the page it points to — things large enough that the effect is visible without statistics.
Mistakes that cost real money
Optimising before verifying measurement. You are tuning against numbers that may be wrong.
Running A/B tests on insufficient traffic. The results are noise and you will act on them.
Starting with copy. Visible, enjoyable, and usually not the constraint.
Sending all ad traffic to a homepage. The most common message-match failure and one of the easiest to fix.
Removing form fields without deciding what happens to lead quality. Volume rises, qualification falls, and the sales team absorbs it.
Testing two things at once on a page with modest traffic. You lose the ability to attribute any result.
When the landing page is not the problem
When the traffic is wrong. A page converting at 0.5% from broad keywords may be a targeting problem, not a page problem — which conversions are worth optimising toward covers the signal side.
When the offer is uncompetitive. No page rescues a proposition the market has priced against.
When follow-up is slow. A page can only produce the enquiry. What happens next is where most of the loss sits, and it is invisible in conversion rate.
When the conversion is not worth what it costs. Before optimising anything, know what a lead is worth — working out what a lead is actually worth has the arithmetic.
The diagnostic checklist
☐ Conversion tracking verified as firing once, on real completion
☐ Analytics reconciled against actual enquiries for one week
☐ Traffic figure checked for bots, internal visits and duplicate tags
☐ Page loaded on a mid-range Android phone on mobile data
☐ Largest Contentful Paint measured against the 2.5-second threshold
☐ Headline and primary action confirmed visible on a phone without scrolling
☐ Ad copy and page headline compared side by side for message match
☐ Ad-group traffic confirmed as landing on matched pages, not the homepage
☐ Form completed personally on a phone, as a stranger would
☐ Field-level abandonment checked in form analytics
☐ Price or price range present, or its absence decided deliberately
☐ One named client outcome present, beyond a logo wall
☐ Response-time promise stated on the page
☐ Monthly traffic compared against the sample size your baseline requires
☐ Below the traffic line — session recordings watched and five users observed
Questions we get asked
How do I improve my landing page conversion rate?
Diagnose in order before changing anything. Measurement, rendering, message match, completion, objections, then copy. Most pages have a fault in the first three.
What is a good landing page conversion rate?
The wrong question in isolation, because it depends on traffic quality, offer and price point. A better one is whether your cost per conversion is below what a customer is worth.
How much traffic do I need to A/B test?
For a page at 3% detecting a 20% improvement, roughly 13,900 visitors per variant at conventional confidence — about 27,800 in total. Below a few thousand visitors a month, testing is not realistically available.
Why is my landing page not converting?
In our experience the order of likelihood is: tracking is wrong, the page does not match the ad, the form is broken on mobile, or the price question is unanswered. Copy is rarely the primary cause.
How many form fields should a landing page have?
Fewer fields produce more submissions and less qualification. The right number depends on whether your sales team can absorb unqualified volume, not on a universal figure.
Should I use a landing page builder or my own site?
Whichever renders faster on a mid-range phone and lets you change things quickly. That is the whole decision for most businesses.
The first thing to check today
Open your analytics, count the conversions it reports for last week, then count the actual enquiries that reached your inbox or CRM.
If those two numbers disagree, stop optimising. Everything you would change is being judged against a figure that is not true, and you will not know whether any change helped.
If they agree, open the page on a phone, on mobile data, and try to complete the form as a stranger would. Most diagnoses end there.
If you would like a diagnosis run properly — including whether your traffic supports testing at all — you can reach out to us on whatsapp at +91 7738844851.
More in Blog
Keep reading
All articles →

Ready to talk about your growth?
Tell us what's stuck and we'll tell you what we'd do first. Free, 30 minutes, no pitch.