
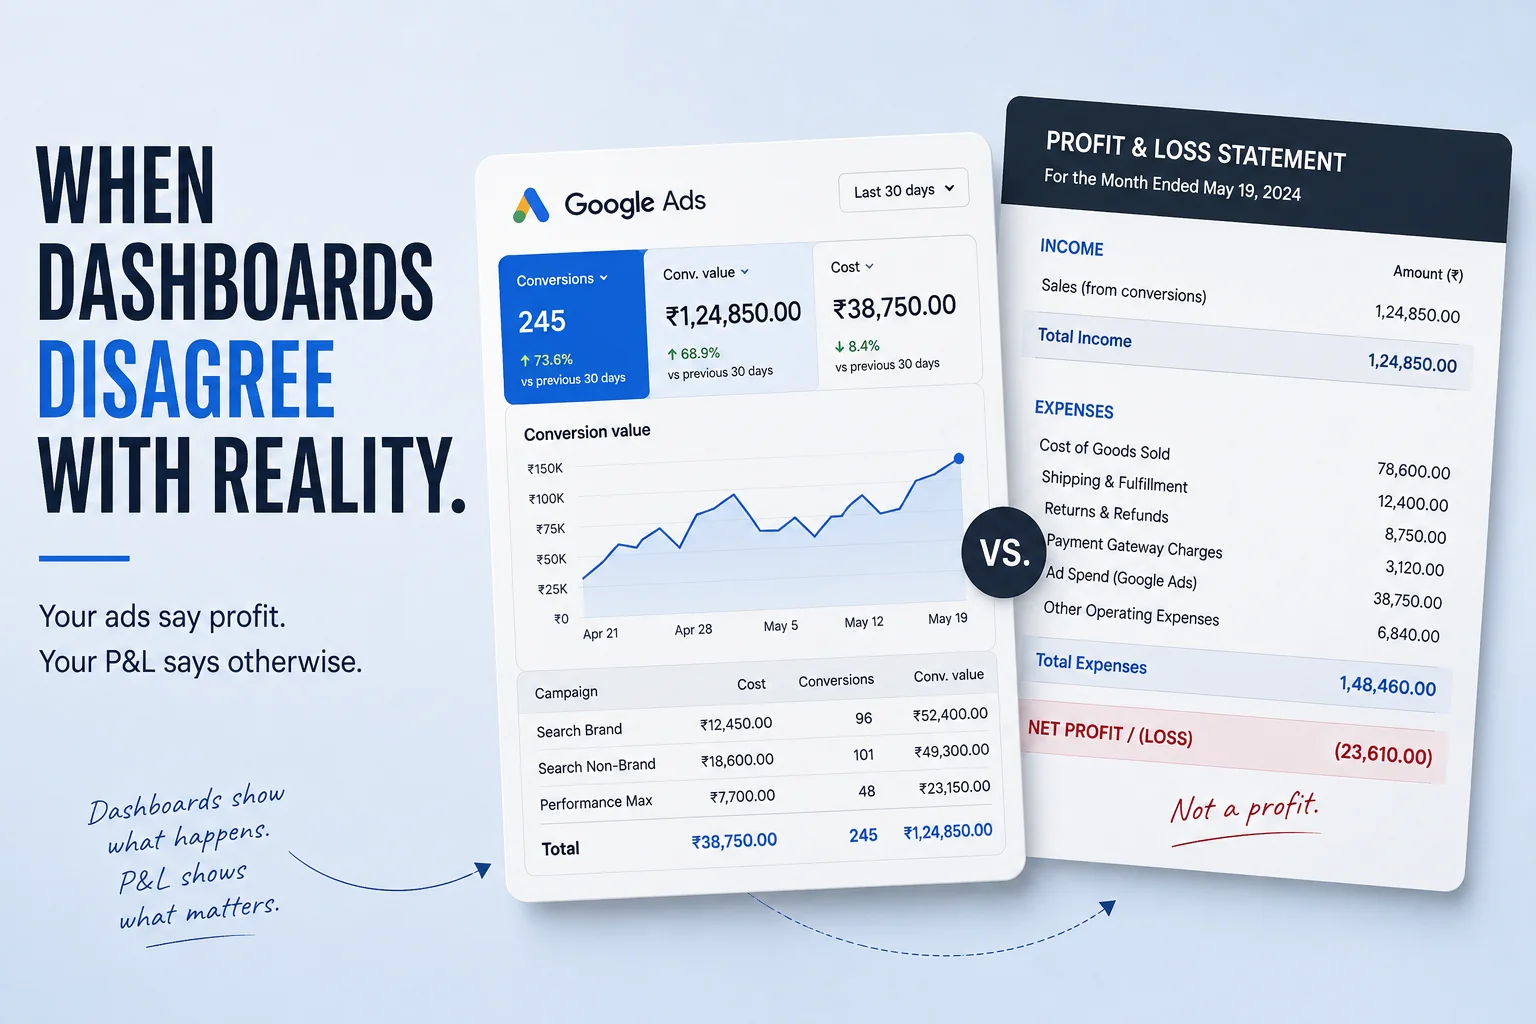
A 4:1 return sounds healthy. Four rupees back for every one spent.
For a business on 25% gross margin, 4:1 is break-even. Exactly. Not a good quarter, not a bad one — nothing. Spend more and you lose money faster, with a dashboard that keeps looking fine.
This is the most common expensive misunderstanding in paid media, and it comes from a formula that is quietly wrong on several of the pages ranking for this exact question.
The short answer
ROAS is revenue divided by ad spend. ROI is profit divided by cost, and profit requires subtracting what the product cost to make. Google’s own documentation defines ROI as revenue minus cost of goods sold, divided by cost of goods sold — yet several widely-read guides use ad spend in place of cost of goods sold, which produces ROAS wearing a different name. The number that matters is your break-even ROAS: one divided by your gross margin.
Key takeaways
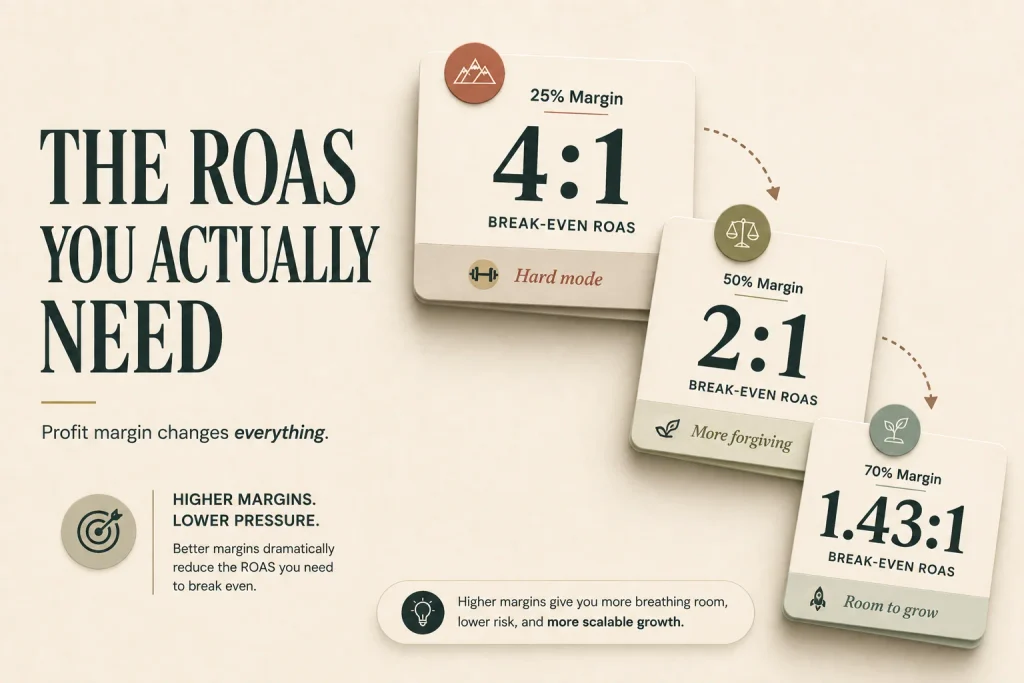
- Break-even ROAS = 1 ÷ gross margin. At 25% margin that is 4:1. At 50%, 2:1. At 70%, about 1.43:1.
- ROAS cannot tell you whether you made money. It has no knowledge of your costs.
- Google’s own definition of ROI includes cost of goods sold. Several ranking guides omit it and call the result ROI anyway.
- Lead generation businesses cannot compute either metric without a value per lead, which needs a close rate and an average order value.
- The measurement is only as good as the tracking, and tracking failures are common enough that any surprising ROI figure should be treated as a tracking question first.
The two numbers, and why they get confused
ROAS is conversion value divided by ad spend. Spend ₹1,00,000, generate ₹4,00,000 in tracked revenue, ROAS is 4. It is a revenue ratio and it is the number Google’s interface shows you most readily.
ROI is return relative to cost, expressed as profit. Google’s documentation puts it as revenue minus cost of goods sold, divided by cost of goods sold.
The distinction is not pedantry. ROAS knows nothing about your business. It cannot see your margins, your delivery costs, your refunds or your agency fee. It is a measure of advertising efficiency, and advertising efficiency and profitability are different things that happen to move together sometimes.
Here is where the ranking guides go wrong. Several use (Revenue − Ad Spend) ÷ Ad Spend and label it ROI. Substitute numbers and you will see it is just ROAS minus one. A 4:1 ROAS becomes “300% ROI” — which sounds transformative and describes a business that made nothing.
The Break-Even Line
Every account has a ROAS below which it loses money. That number is one divided by your gross margin, and it is set by your business rather than your industry. Until you know it, no benchmark can tell you anything useful.
The arithmetic is short.
If your gross margin is 25%, every ₹100 of revenue leaves ₹25 to cover advertising and everything else. To recover ₹1 of ad spend you need ₹4 of revenue. Break-even ROAS is 4:1.
At 50% margin, ₹2 of revenue covers ₹1 of spend. Break-even is 2:1.
At 70% margin — typical of software or services — break-even is about 1.43:1.
One divided by your gross margin. That is the whole formula.
Two businesses reporting identical 3:1 ROAS are therefore in opposite situations. The 70%-margin business is comfortably profitable. The 25%-margin business is losing money on every sale and scaling the loss.
Which is why industry benchmarks mislead more often than they help. A published figure for your sector aggregates businesses with different margins, different products and different cost structures. It can tell you whether your advertising is efficient relative to peers. It cannot tell you whether you are profitable. When you do want the comparison, what a good ROAS looks like by industry in India sets out the figures — read alongside your own break-even, not instead of it.
Going beyond break-even. To earn a target margin rather than merely survive, divide again. If you want 20% profit on advertised revenue at 25% gross margin, you need roughly 20:1 — which usually reveals that the target is unreachable and the product margin is the real problem.
That is the uncomfortable gift of this calculation. It often shows that the campaign is not underperforming; the unit economics never worked.
What to do if you sell leads, not products
Most Indian B2B and services businesses cannot use any of the above directly, because there is no transaction on the website. Someone fills a form. That is not revenue.
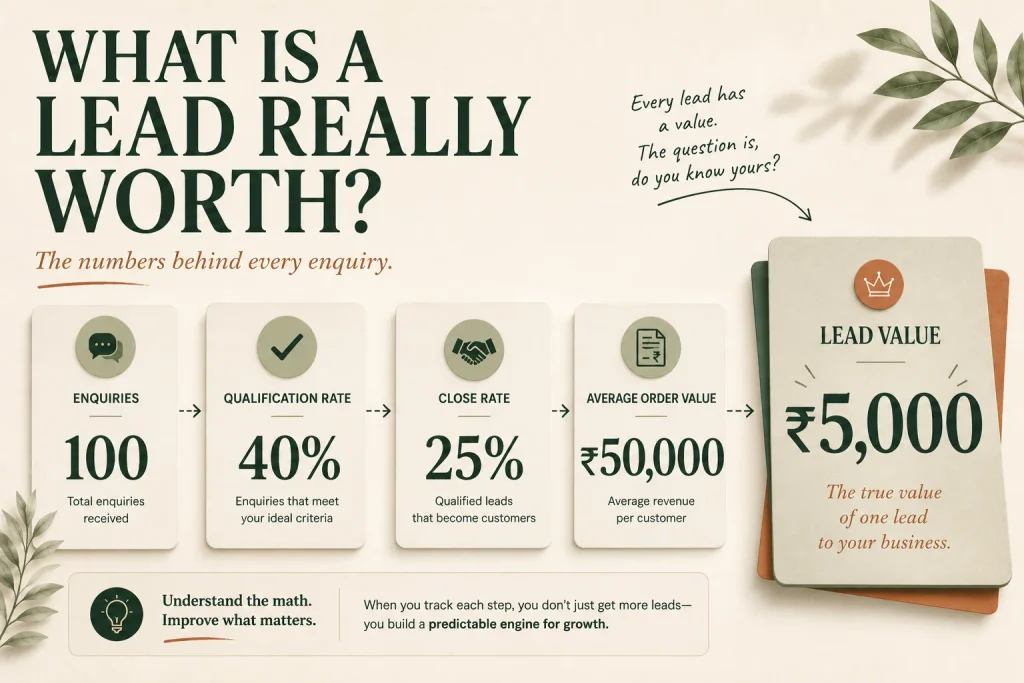
Build a value per lead in four steps.
Average order value. What a closed customer is worth. Use gross profit rather than revenue and you get straight to the useful number.
Close rate. Of enquiries that reach sales, what proportion become customers? Most businesses know this within a range even if nobody has written it down.
Qualification rate. Of form fills, what proportion are real? This is the step people skip and it is usually where the number collapses.
Multiply. A ₹2,00,000 average deal at 25% gross profit is ₹50,000 of profit. A 20% close rate on qualified leads makes a qualified lead worth ₹10,000. If only half of form fills qualify, a form fill is worth ₹5,000.
Now you have a value to assign in Google Ads, and a cost per lead that means something. Under ₹5,000, you are ahead. Over it, you are not.
Better still, import the outcome. Google supports offline conversion imports so closed deals flow back from your CRM. The algorithm then optimises toward customers rather than form-fillers, which is a different and much better instruction. Our guide on which conversions are worth optimising toward covers what to feed back.
Why the number on your dashboard is probably wrong
Before drawing conclusions from any ROI figure, treat it as a tracking question.
Duplicate counting. The same conversion firing from a tag and a plugin, or a thank-you page counted on every refresh. Inflates everything downstream.
Conversion actions counted twice in one column. Both a form fill and a phone call recorded as primary conversions for the same enquiry.
Attribution windows longer than your memory. A conversion credited today may belong to spend from three weeks ago. Comparing this week’s cost to this week’s conversions produces nonsense in both directions.
Brand searches counted as acquisition. People who already knew you, found through your own name, credited to advertising.
Nothing at all. More common than anyone admits. Agencies that audit accounts report tracking faults in a large majority of the accounts they inspect — one B2B-focused agency puts it at 70–80% of the accounts it reviews, though that figure comes from a firm selling tracking fixes and should be read with that in mind.
Consent and modelled conversions. Some conversions are now estimated rather than observed. Reasonable, and worth knowing when a number looks unusually precise.
If your Google Ads conversions and your CRM disagree, the CRM is right. Start there.
Mistakes that cost real money
Optimising to ROAS without knowing your break-even. The central error, and it looks like diligence.
Using revenue instead of gross profit when assigning conversion values. Inflates every downstream figure.
Judging campaigns over too short a window. Automated bidding needs volume; Google recommends at least 50 conversions in 30 days for Target ROAS to work reliably.
Ignoring the agency fee. It is a cost of the channel. Include it, or your ROI is flattering by exactly that amount.
Treating last-click as truth. It is one model among several and it systematically underweights everything that happens before the final click.
Cutting the campaigns that look worst on ROAS without checking whether they feed the ones that look best.
When ROI is the wrong question
In the first quarter. Learning periods, thin data and delayed conversions make early ROI figures unreliable. Judge leading indicators — cost per qualified lead, conversion rate — until the account stabilises.
When the sales cycle is long. A six-month B2B cycle means today’s ROI reflects spend from two quarters ago. Pipeline value is the more honest measure.
When conversion volume is too low to be statistically meaningful. Twelve conversions a month cannot produce a reliable ratio, and the arithmetic will swing wildly for reasons unconnected to performance. Why conversion volume decides what you can run covers the thresholds.
When you are testing a new market. Early spend buys information. Charging that to ROI misrepresents what it was for.
The measurement checklist
☐ Gross margin calculated, using gross profit rather than revenue
☐ Break-even ROAS worked out — one divided by gross margin
☐ Target ROAS set above break-even, with a stated profit goal
☐ Conversion tracking verified as firing, and firing once
☐ Primary and secondary conversion actions separated deliberately
☐ Conversion values assigned using gross profit, not revenue
☐ Brand search performance reported separately from acquisition
☐ Attribution window understood and matched to your sales cycle
☐ Google Ads conversions reconciled against CRM records
☐ Offline conversion import configured, if you sell to leads
☐ Agency fees and tooling included in the cost side
☐ One review interval agreed, appropriate to the sales cycle
Questions we get asked
What is a good ROI for Google Ads?
Anything above your break-even, sustained. There is no universal figure, and any article giving one without asking your margin is guessing.
What is the difference between ROI and ROAS?
ROAS is revenue divided by ad spend. ROI is profit relative to cost and includes what the product cost to make. ROAS can be excellent while ROI is negative.
Why do Google Ads conversions not match my CRM?
Attribution windows, duplicate tags, modelled conversions and definition mismatches. Some divergence is normal; a large or growing gap is a tracking fault.
Should I use Target ROAS bidding?
Only once you know your break-even and have the conversion volume for it — Google recommends at least 50 conversions in 30 days. Setting a target below break-even instructs the system to lose money efficiently.
How long before I can judge ROI?
A full sales cycle plus a learning period. For most Indian B2B accounts that is a quarter at minimum.
Does a higher budget improve ROI?
Usually the reverse. Additional spend generally buys progressively less qualified traffic, so ROI tends to fall as volume rises. The question is where it falls below your break-even.
Two numbers, this afternoon
Find your gross margin. Divide one by it. That is your break-even ROAS, and it is the only number on this page that is specific to you.
Then compare it to what your account is currently returning. Most people doing this for the first time find the gap is not where they expected — sometimes the account is healthier than it looked, more often the target it has been optimising toward was set by habit rather than arithmetic.
If the numbers do not reconcile, the tracking is the first suspect, not the campaigns.
We are happy to look at both. you can reach out to us on whatsapp at +91 7738844851 and we will tell you what your break-even is, whether your tracking supports the figures you are seeing, and whether the account is worth scaling at all.
More in Blog
Keep reading
All articles →
Ready to talk about your growth?
Tell us what's stuck and we'll tell you what we'd do first. Free, 30 minutes, no pitch.