
Almost every article about improving a landing page assumes one thing: the traffic costs what it costs, and your job is to convert more of it.
On Google Ads that assumption is wrong, and the difference matters more than any individual tactic.
Your landing page is scored. That score affects your ad rank. Ad rank affects what you pay per click. So a page improvement raises the proportion of visitors who convert and lowers the price of each visitor arriving.
The short answer
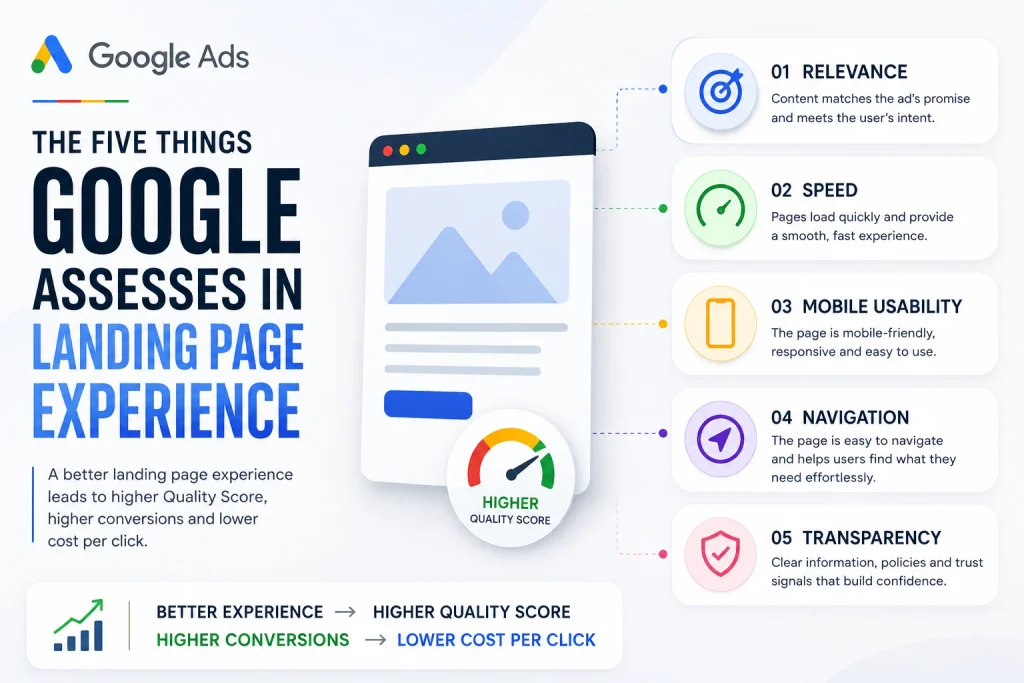
Landing page experience is one of three components Google uses to assess Quality Score, alongside expected click-through rate and ad relevance. Quality Score reflects the same quality signals used in Ad Rank, which determines whether your ad shows and what you pay. Google assesses relevance to the keyword and ad, page load speed, mobile usability, ease of navigation, and transparency about your business. Improving these raises conversion and reduces cost per click at once, which is why paid landing pages should be fixed before any others.
Key takeaways
- Landing page experience is one of three documented Quality Score components.
- The same fix improves conversion and reduces cost per click. No other page work does both.
- Google names five things it assesses, and transparency is the one almost nobody addresses.
- Changes do not register immediately. Expect a few weeks while crawling and behavioural signals update.
- Quality Score is a diagnostic, not a target. Google’s own guidance frames it that way.
What Google actually measures
Worth being precise, because most advice on this topic is vague about the mechanism and specific about tactics — which is the wrong way round.
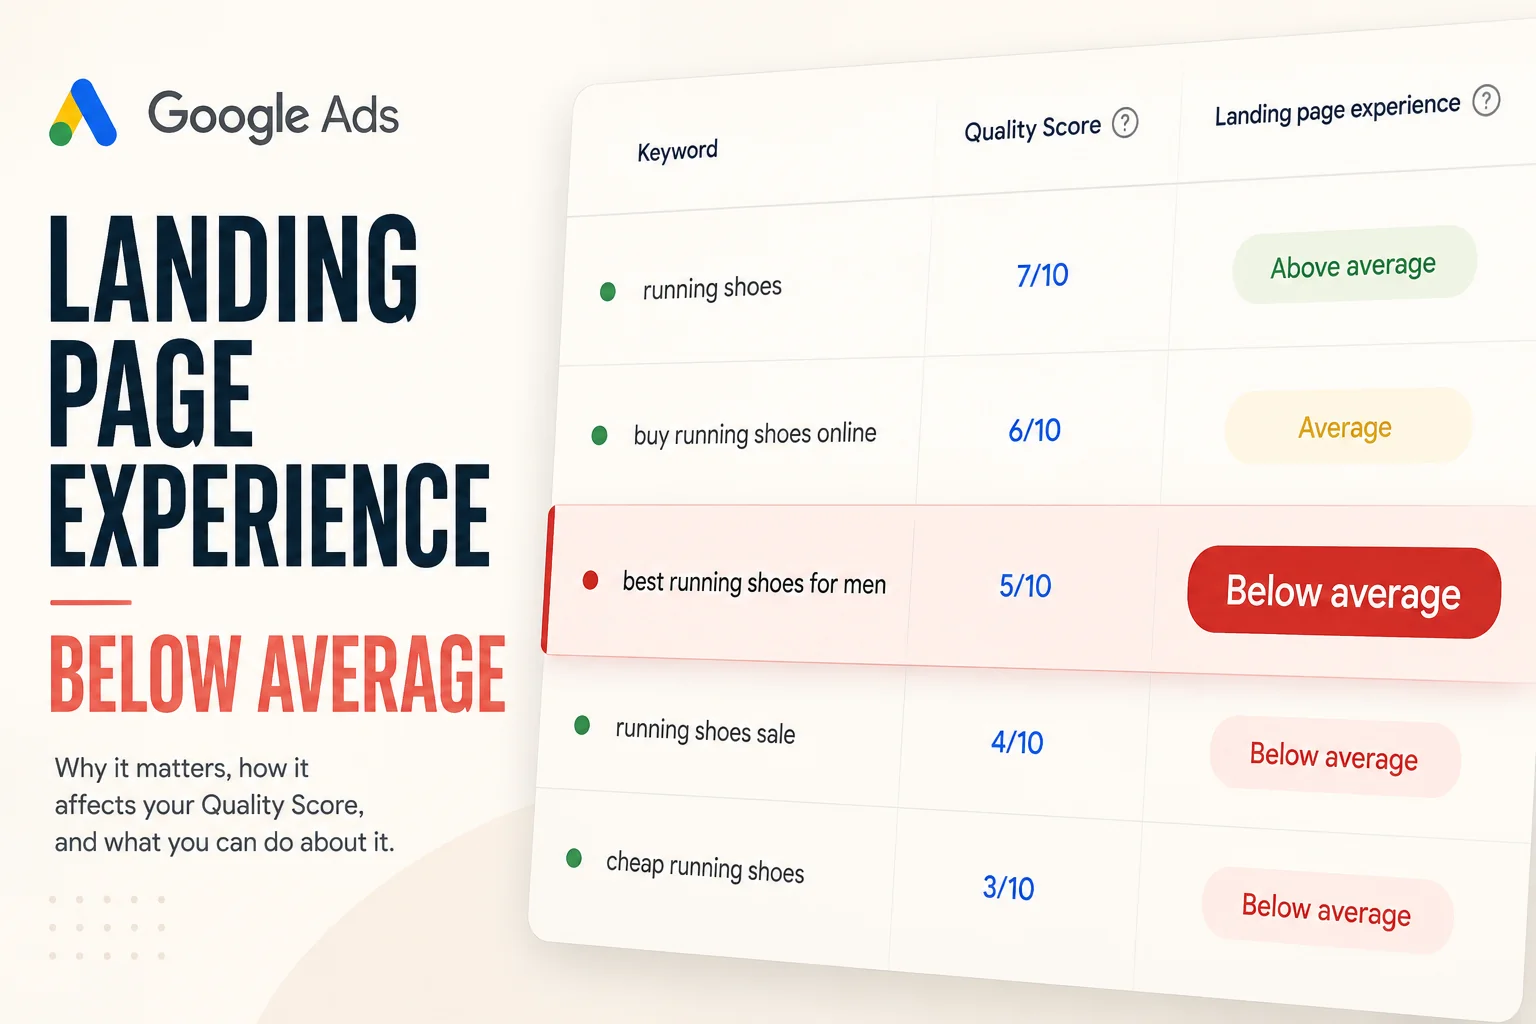
Quality Score has three components: expected click-through rate, ad relevance, and landing page experience. It is reported at keyword level on a scale of one to ten, with each component shown as above average, average or below average.
Landing page experience assesses five things, per Google’s documentation and guidance:
Relevance to the keyword and the ad. Does the page deliver what the ad promised for the term that triggered it?
Load speed. How quickly the page becomes usable.
Mobile usability. Whether it works properly on a phone, which for Indian traffic is most of it.
Ease of navigation. Whether people can find what they came for without hunting.
Transparency. Whether the page is open about who you are, what your business does, and how you handle visitor information.
That last one gets almost no attention and is often the cheapest to fix.
The Double Return
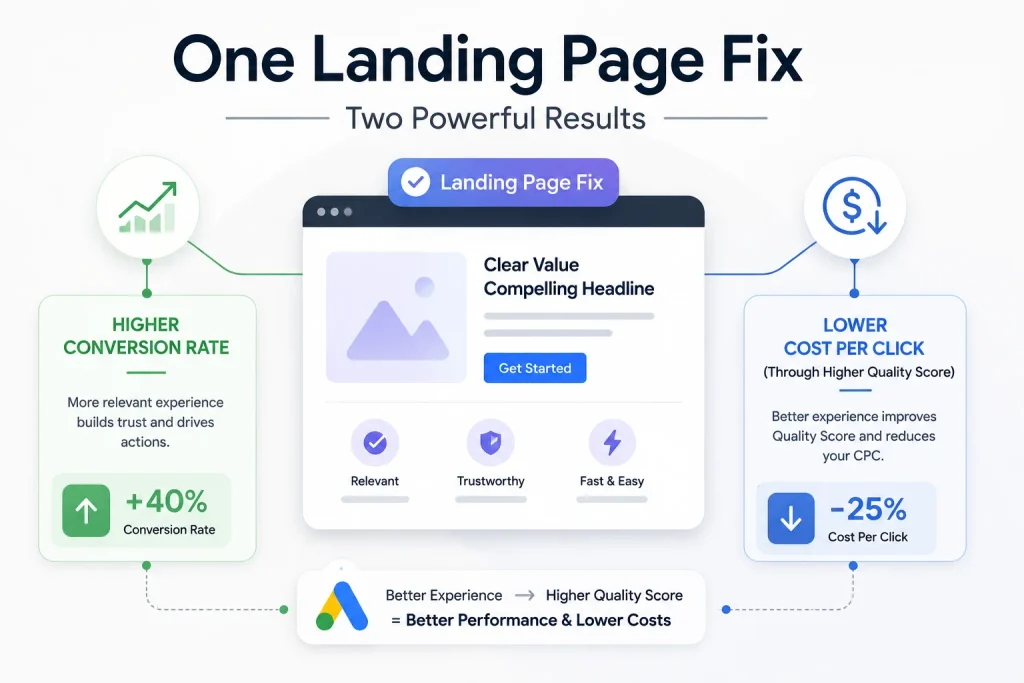
Every other conversion improvement raises the share of visitors who act. This one does that and reduces what each visitor cost to acquire, because the page feeds Quality Score, Quality Score reflects the signals in Ad Rank, and Ad Rank determines what you pay. One change, two effects.
The mechanism, stated plainly.
Ad Rank determines whether your ad appears and in what position. It is calculated using your bid, the quality of your ad and landing page at auction time, context, and the expected impact of your assets and formats.
Because quality is part of that calculation, a higher-quality advertiser can achieve the same position at a lower bid than a lower-quality one. That is the entire mechanism, and it is why landing page work on paid traffic is different in kind from landing page work anywhere else.
What this changes about priority. If you have one afternoon and two pages — a landing page receiving paid traffic and one receiving organic — fix the paid one first. The organic fix returns conversion improvement alone. The paid fix returns conversion improvement plus a reduction in what you paid to get there.
We are deliberately not quoting a figure for how much. Claims circulate about specific cost differences between Quality Score bands, and about conversion multiples from particular load times. None traces to Google or to independent research. The mechanism is documented; the magnitude depends on your auction, your competitors and your category, and anyone stating it precisely is guessing on your behalf.
Fixing each component
In the order that usually pays.
Relevance — the biggest and the most commonly broken
The failure. Ad group traffic landing on a general page. Someone searches a specific term, sees an ad about that term, and arrives somewhere that mentions it in the fourth paragraph.
The fix. The page headline should contain the thing the ad promised, in the words the searcher used. Not a synonym, not a category, the thing.
The structural version of the fix. If one page has to serve eight ad groups, either the page is too general or the ad groups are too broad. Consolidating ad groups often improves relevance faster than editing the page.
Where traffic should land in the first place is a separate decision — whether you need a landing page at all covers it, and choosing the wrong destination is the most common cause of a poor relevance score.
Speed — measured on a phone, on mobile data
The failure. A page that renders in two seconds on office wifi and eleven on a mid-range Android on a patchy connection.
The fix. Measure Largest Contentful Paint against Google’s threshold of 2.5 seconds for a good experience. Compress images, defer what is not needed for first render, and remove tracking scripts nobody reads the output of.
The Indian-specific note. Test on a real mid-range device on mobile data, not on a throttled desktop simulation. The gap between those two measurements is where most Indian landing pages actually lose people.
Mobile usability
The failure. Forms that fight mobile keyboards, tap targets too small to hit, horizontal scrolling, and text that requires zoom.
The fix. Complete your own form on your own phone. Most problems announce themselves within thirty seconds and none of them appear in a desktop review.
Ease of navigation
The failure. Interstitials, popups on arrival, and pages where the action is below three screens of scrolling.
The fix. Remove anything that appears before the visitor has read anything. An entrance popup is a navigation obstacle in Google’s terms and an irritation in the visitor’s.
Transparency — the component nobody works on
What Google is looking for. Clarity about who you are, what your business does, and what happens to information a visitor provides.
The practical version. A real business name and address. A working contact route. A privacy policy that is linked and loads. Clear statement of what you do — not a slogan, a description. If you collect data, plain language about what happens to it.
Why it is worth doing first. It is the cheapest of the five to fix, it requires no design work, and most Indian landing pages fail it in ways that take an hour to correct — a missing address, an unlinked privacy policy, a company name that appears nowhere on the page.
HTTPS is table stakes. A page served over plain HTTP raises browser warnings and undermines every other trust signal you have.
What to expect, and when
Quality Score does not update the morning after you change a page.
Reported practitioner experience puts meaningful movement at roughly two to four weeks, as Google re-crawls the page and behavioural signals accumulate. That is consistent with how the component works — some of it is content assessment, some of it is how people behave once they arrive.
Which means two things. Do not judge a fix in three days. And do not make five changes at once and then wonder which one moved the number.
Treat Quality Score as a diagnostic rather than a target. Google’s own guidance frames it that way — it tells you where to look, not what to optimise directly. Chasing the score itself produces odd behaviour; fixing what the score is measuring produces better accounts.
Mistakes that cost real money
Sending ad traffic to the homepage. The single most common cause of poor relevance, and it costs in both directions.
Testing speed on a laptop. Your visitors are not on your laptop.
Popups on arrival. A navigation obstacle by Google’s description and a bounce generator in practice.
Missing basic business information. Free to fix, and it fails the transparency component silently.
Judging changes within days. The signals take weeks to update and you will conclude nothing worked.
Optimising the score instead of the page. The score is a proxy. Improving what it measures is the actual work — what campaign management involves week to week covers where this fits in the routine.
When the landing page is not what is wrong
When the keywords are wrong. A page cannot be relevant to a search term that has nothing to do with your business, and relevance scores will reflect that correctly.
When the ad promises something the page cannot deliver. The fix is the ad, not the page.
When conversion tracking is broken. You will be optimising against numbers that are not true — how to find which problem to fix first sets out the diagnostic order.
When the offer is uncompetitive. Quality Score measures experience, not proposition. A well-built page for an overpriced product scores fine and sells nothing.
When the account has too little volume for any signal to stabilise. Quality Score at low impression volumes moves for reasons unrelated to your changes.
The Google Ads landing page checklist
☐ Landing page experience column enabled in the keyword view
☐ Keywords marked below average identified and grouped
☐ Ad group and destination page mapped one to one where possible
☐ Page headline containing the exact term the ad promised
☐ Largest Contentful Paint measured on a mid-range phone on mobile data
☐ Own form completed on own phone, start to finish
☐ Entrance popups and interstitials removed
☐ Real business name and address present on the page
☐ Working contact route beyond a form
☐ Privacy policy linked and loading
☐ HTTPS confirmed across the whole page including assets
☐ One change at a time, with a two-to-four week review window
Questions we get asked
What is landing page experience in Google Ads?
One of three Quality Score components, assessing how relevant and useful your page is to someone who clicked your ad. Google looks at relevance, speed, mobile usability, navigation and transparency.
Why is my landing page experience below average?
Most often relevance — the page is more general than the ad. After that, mobile speed and missing business information.
Does landing page experience affect cost per click?
Yes, through the mechanism. Quality is part of Ad Rank, and a higher-quality advertiser can hold the same position at a lower bid. How much depends on your auction and nobody can tell you a figure honestly.
How long does Quality Score take to update?
Reported experience suggests a few weeks rather than days, as pages are re-crawled and behavioural data accumulates.
Does Google Ads care about page speed?
Yes — load speed is one of the named components. Measure it on a phone on mobile data, which is where most Indian traffic sits.
Should I chase a Quality Score of 10?
No. Google’s own guidance treats it as a diagnostic. Fix what it points at and let the number follow.
The check to run today
Open Google Ads, go to your keywords, and add the landing page experience column if it is not already showing.
Sort by it. Everything marked “Below average” is costing you twice — worse conversion and a worse position for the same bid.
Then take the worst one and open its destination page beside the ad that sends traffic there. In most accounts the problem is visible immediately: the ad promises something specific and the page is about the company in general.
Fix that first, wait a fortnight, and look again.
If you would like an account reviewed for what your landing pages are costing you in Quality Score as well as in conversions, you can reach out to us on whatsapp at +91 7738844851 .
More in Blog
Keep reading
All articles →


Ready to talk about your growth?
Tell us what's stuck and we'll tell you what we'd do first. Free, 30 minutes, no pitch.