Instagram Engagement Rate: Which Formula to Use, and What’s Good
How to calculate Instagram engagement rate by followers, reach or views, what counts as good in 2026, and the per-reach metrics Instagram actually ranks on.

The short answer
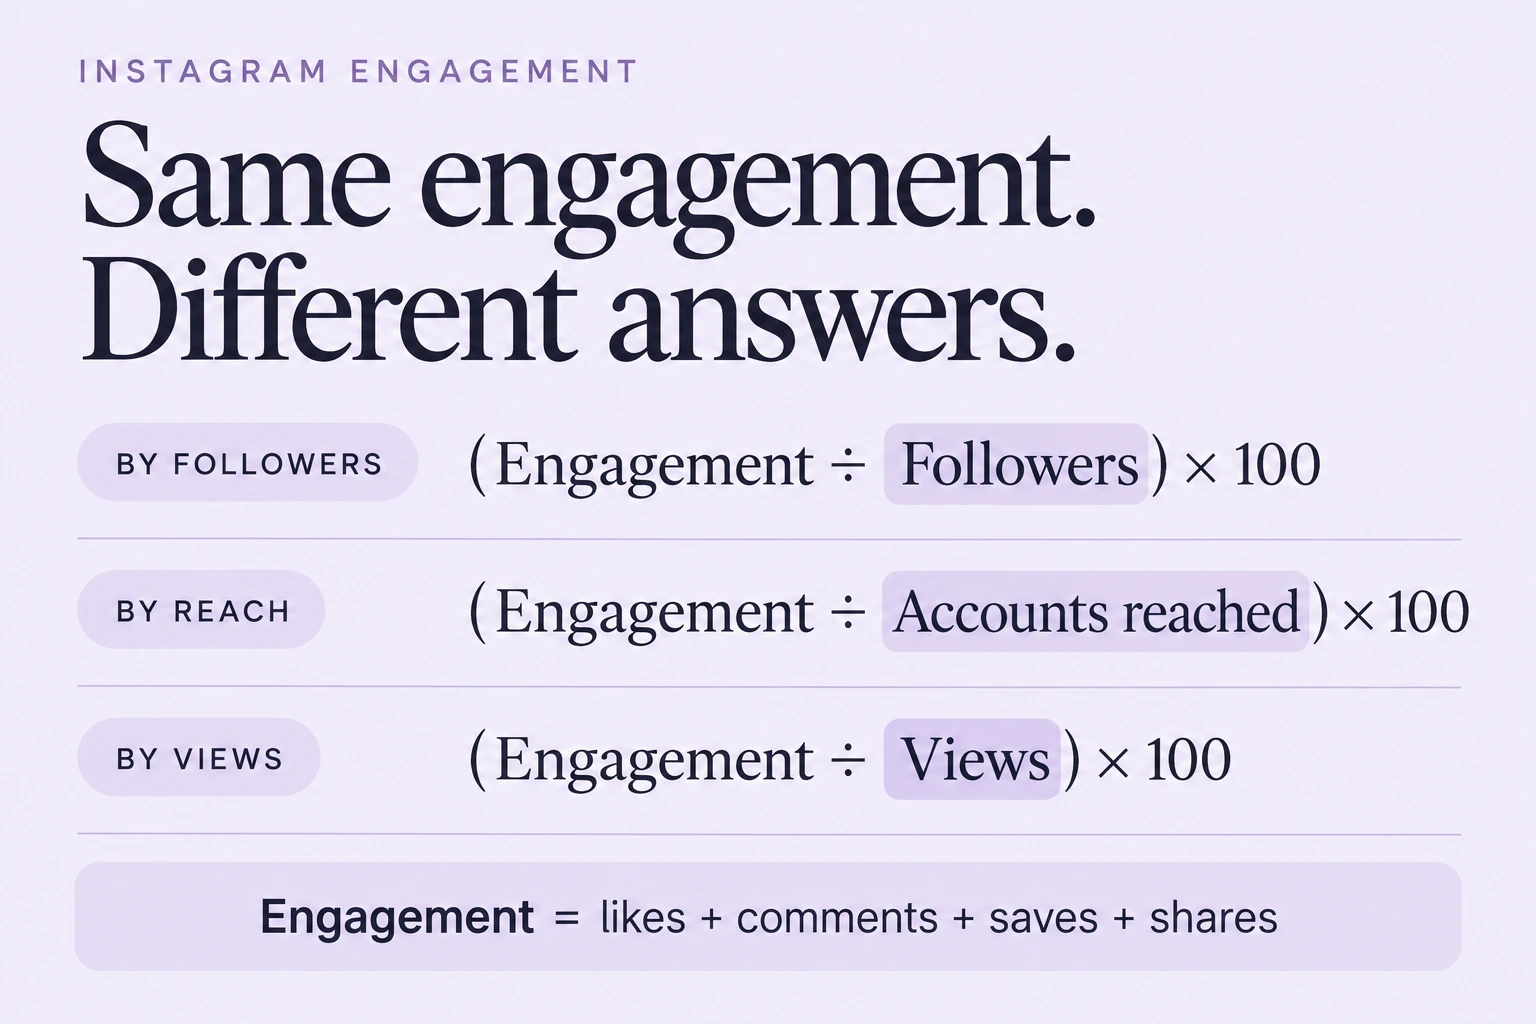
The common formula is (likes + comments + saves + shares) ÷ followers × 100. It’s useful for comparing accounts. For judging your own content, use engagement ÷ reach × 100, because Instagram ranks posts on per-reach signals: its head, Adam Mosseri, told creators to watch “likes per reach and sends per reach”. As a benchmark, Socialinsider’s 2026 report puts the average follower-based rate at 0.48%, with carousels at 0.55% and Reels at 0.52%. Compare like with like: a per-reach rate and a per-follower rate are different numbers.
Three formulas, three jobs
1. Engagement rate by followers
(Likes + comments + saves + shares) ÷ followers × 100
Use it for: comparing your account with competitors, or vetting a creator before a campaign. You can calculate it from public numbers for likes and comments.
Weakness: it punishes large accounts and ignores that most Reel views come from non-followers.
2. Engagement rate by reach
(Likes + comments + saves + shares) ÷ accounts reached × 100
Use it for: judging your own posts. It tells you what share of the people who saw it did something.
Weakness: you can only see reach for your own account (or a creator who shares their insights).
3. Engagement rate by views
Engagement ÷ views × 100
Since 21 April 2025, Instagram’s reporting replaced “impressions” and “plays” with views, which count repeat views too. Some tools now calculate engagement on views. It gives a lower number than reach. Fine for trends over time; don’t mix it with the other two.
Worked example
An illustrative Reel from a Mumbai home-décor brand with 12,000 followers:
- Accounts reached: 30,000 (most of them non-followers)
- Likes 900, comments 60, saves 240, shares 300. Total engagement 1,500
By followers: 1,500 ÷ 12,000 × 100 = 12.5%
By reach: 1,500 ÷ 30,000 × 100 = 5%
Both are correct. They answer different questions. The follower figure looks impressive only because the Reel reached far beyond the follower base.
The per-reach scorecard
Engagement rate lumps everything together. Instagram doesn’t.
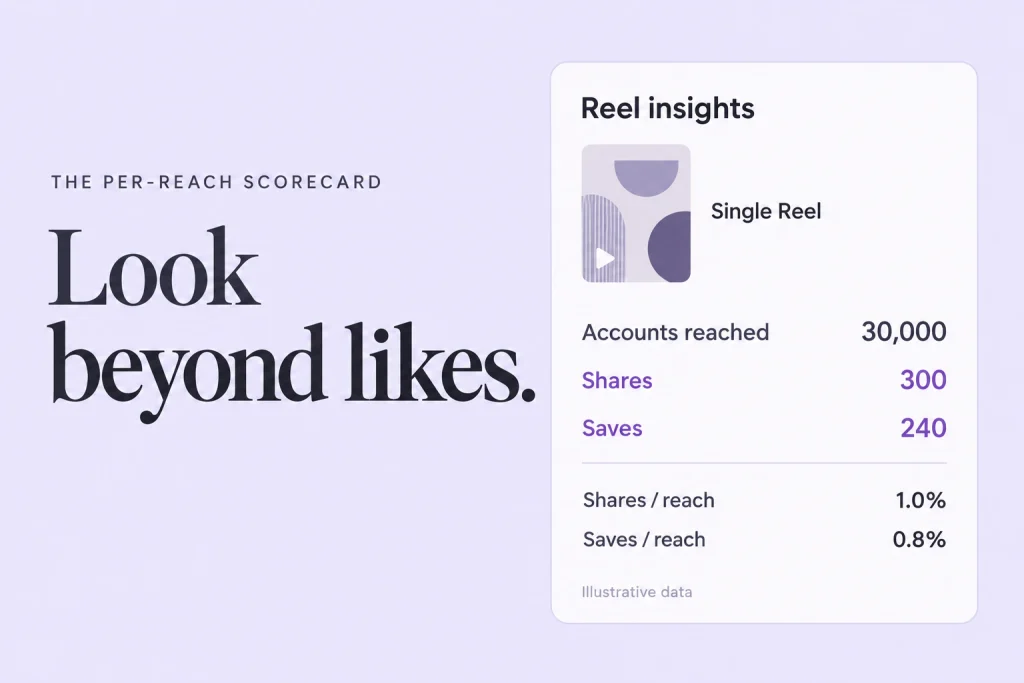
In January 2025 Mosseri said the top three ranking signals are watch time, likes and sends, and advised watching average watch time, likes per reach and sends per reach. Likes carry more weight with followers; sends carry more weight for reaching people who don’t follow you yet.
So track these separately for every post:
- Sends per reach: shares ÷ accounts reached. Your best predictor of reach to new people
- Likes per reach: likes ÷ accounts reached. How well the post lands with people who see it
- Saves per reach: saves ÷ accounts reached. Useful for carousels and educational posts
- Average watch time (Reels): in the Reel’s insights
- Follows from post: did it turn viewers into followers?
A post with modest likes but high sends per reach deserves more attention than its engagement rate suggests.
What’s a good Instagram engagement rate?
Start with the published benchmark, and check its method first.
Socialinsider analysed 35 million posts from 447,613 pages during 2025 and reported an average follower-based engagement rate of 0.48%, down 24% year on year. By format: carousels 0.55%, Reels 0.52%, images 0.37%. Their engagement counts likes and comments only.
How to read that:
- If your follower-based rate is above roughly 0.5%, you’re around or above the average business account in that dataset
- Smaller accounts usually have higher rates. A 2,000-follower local bakery will beat a 2-million-follower brand in percentage terms
- Your own trend matters more than any benchmark. Compare this month with your last three
There’s no reliable India-specific public benchmark. Be wary of any “Indian average” that doesn’t state its sample and method.
Engagement rate for vetting influencers
When you hire creators, engagement rate by followers is the first screen, because it’s all you can see publicly. Then ask for screenshots of reach and audience location. A creator with high engagement but an audience outside India is poor value for a Pune brand. Our guide to nano influencers covers vetting in more detail.
How to improve it
Improve the first three seconds of Reels. Watch time is a top signal. See hook rate.
Make things worth sending. Checklists, cost breakdowns, myth-busters. Carousels are strong here.
Ask for one action. “Send this to your accountant” works better than “like, comment, share and save”.
Reply to comments in the first hour. Conversations add comments and bring people back.
Stop posting filler. Low-effort posts drag your average down and train followers to scroll past.
Mistakes to avoid
Comparing a per-reach rate with a per-follower benchmark. Different denominators, meaningless comparison.
Counting views as reach. Views include repeats; reach is unique accounts.
Chasing comments with giveaways. “Comment to win” inflates comments from people who’ll never buy.
Judging a post after an hour. Look at seven days.
Panicking at a falling average. Benchmarks fell 24% across the board in 2025. Check whether it’s you or the platform before you change strategy, and check reach drop causes.
A simple tracking sheet
One row per post. Columns: date, format, topic, accounts reached, views, likes, comments, saves, shares, follows, average watch time (Reels). Add formula columns for engagement by reach, sends per reach and saves per reach. Review monthly by format and topic. That’s all a calculator tool does.
Questions we get asked
Should saves and shares be in the formula?
Yes, for your own account. They’re the strongest signals of value. Public calculators often leave them out because they can’t see them.
What engagement rate is good for Reels?
Socialinsider’s 2025 data puts Reels at 0.52% by followers. For your own Reels, track per-reach numbers and watch time instead.
Why is my engagement rate dropping while followers grow?
New followers are often less engaged than early ones, and the denominator grows faster than engagement. Look at per-reach metrics.
Final thoughts
Use followers to compare accounts. Use reach, sends and watch time to improve your own. That’s the measurement layer of an Instagram marketing strategy.
Want a tracking sheet set up and a monthly read of what’s working? Book a consultation with our team. You can reach out to us on whatsapp at +91 7738844851.
More in Blog
Keep reading
All articles →


Ready to talk about your growth?
Tell us what's stuck and we'll tell you what we'd do first. Free, 30 minutes, no pitch.