
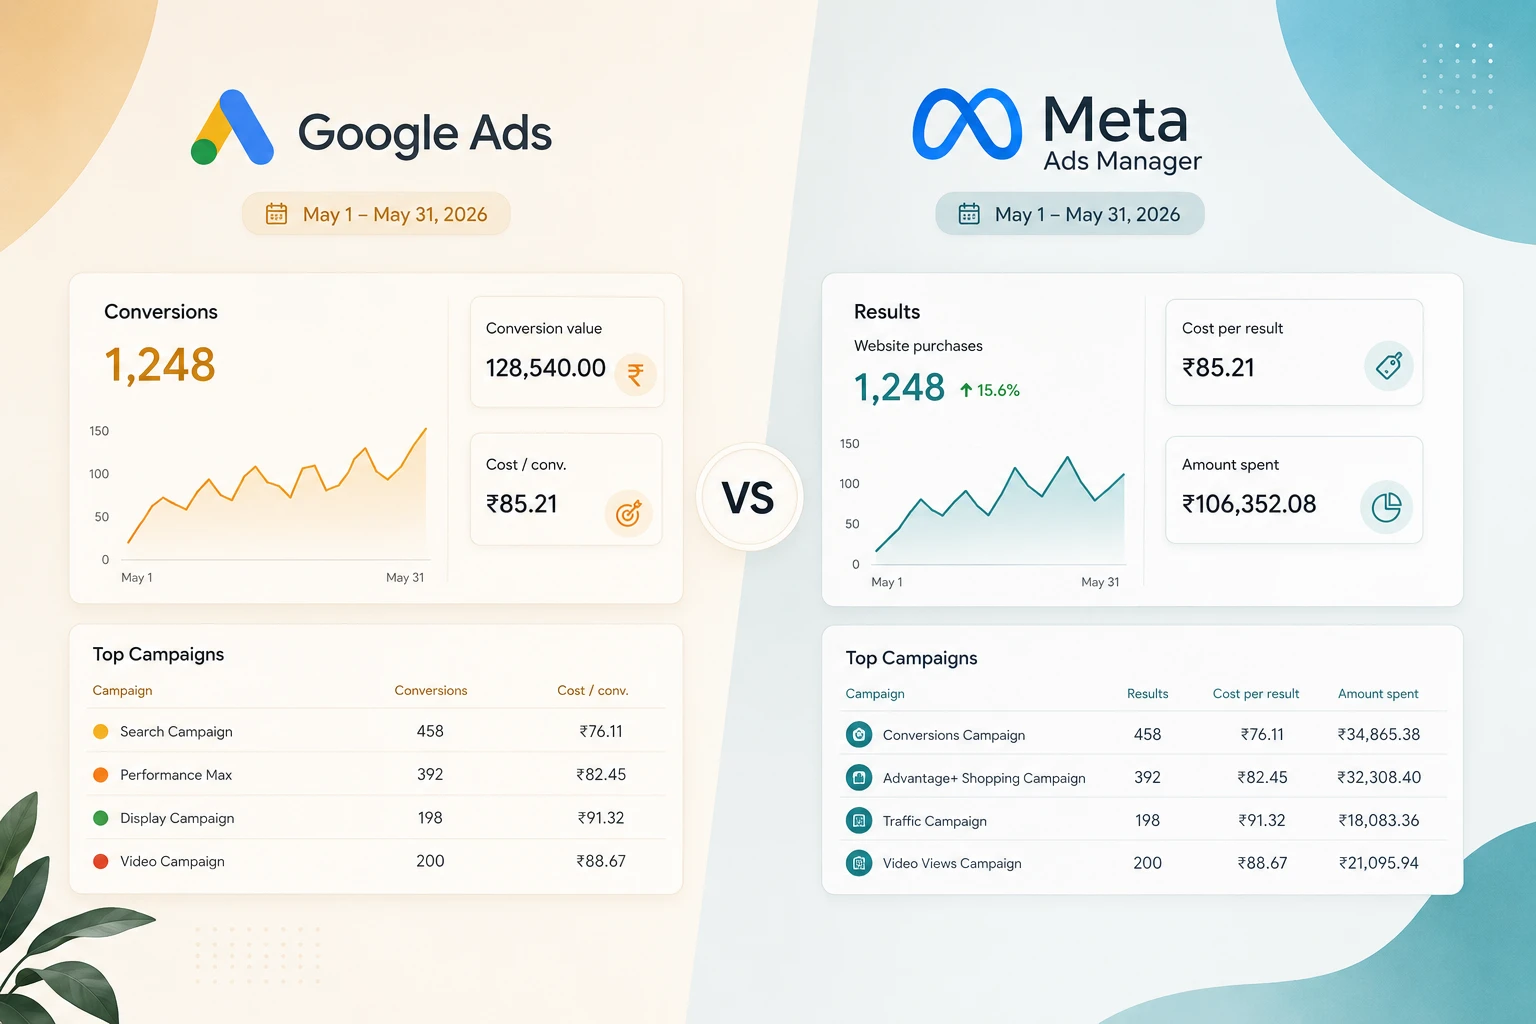
Google Ads reports 60 conversions this month. Meta reports 45. You have 105 conversions.
Your accounts show 78 orders.
Nobody is lying. Both platforms are reporting accurately, by their own definitions, and roughly twenty-seven of those conversions are the same people counted twice. Which means the budget split you are about to make is based on a total that does not exist.
The short answer
Google and Meta each measure conversions independently and each claims credit under its own attribution rules. Someone who saw a Meta ad, searched your brand two days later and clicked a Google ad will often appear in both reports. Add the platforms together and you overstate results by the size of the overlap. Before splitting budget between them, measure that gap — platform-claimed conversions divided by actual recorded conversions. Anything above 1.0 is double-counting, and the size tells you how much of your reporting is fiction.
Key takeaways
- Add your platform reports together and compare against your own records. The ratio is the claim gap.
- Both platforms can honestly claim the same sale. Neither is at fault; they measure separately.
- Meta’s Conversion Lift needs roughly 200,000 users per group and two to four weeks. Most Indian mid-market advertisers cannot run one.
- Geo holdouts work at far smaller scale and are the practical method for most businesses.
- Around half of marketers run no incrementality testing at all, so even a crude test puts you ahead of most competitors.
The Claim Gap
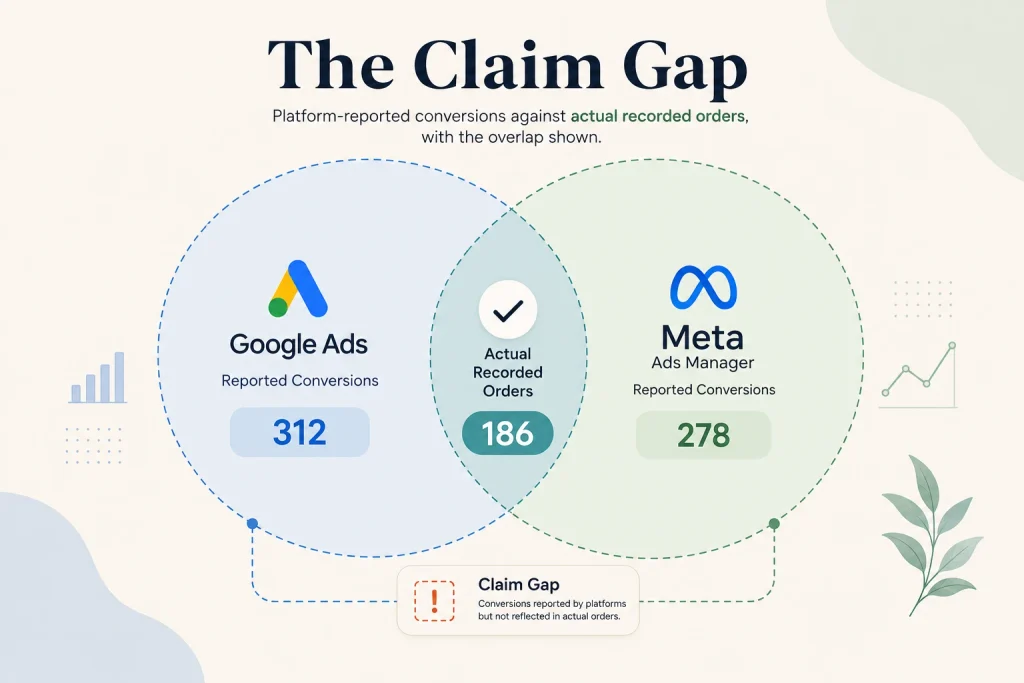
Add up what every platform claims. Divide by what your business actually recorded. Anything above 1.0 is the portion of your reporting that exists twice — and no budget split made on those numbers can be rational.
Take the opening figures.
Google claims 60. Meta claims 45. Combined claim: 105. Actual orders recorded in your own system: 78.
105 ÷ 78 = 1.35. Your platforms are collectively overstating by 35%, and twenty-seven conversions are being counted by two platforms at once.
That single number changes how you read everything else. If Meta reports a cost per acquisition of ₹400 and Google reports ₹300, both figures are understated by an unknown share of that 35% — and the share is almost certainly not equal between them.
Run this before anything else. It requires no tools, no tests and no budget. Platform reports on one side, your CRM or order system on the other, same date range. Most advertisers running both platforms have never done it.
What the size of the gap tells you. Under about 1.1, your platforms barely overlap and your reporting is roughly usable. Between 1.1 and 1.4, meaningful double-counting — treat platform CPAs as indicative only. Above 1.4, your two platforms are largely reaching the same people, which is itself a finding worth acting on.
Why it happens
Not a bug, and worth understanding before trying to fix it.
Different attribution windows. Meta and Google use different default lookback periods for clicks and views. The same conversion can fall inside both.
View-through counting. Meta may credit a conversion to someone who saw an ad without clicking. Google’s search reporting generally will not. So Meta claims influence that Google never sees, and both may be partly right.
Neither platform can see the other. Google does not know your buyer saw an Instagram Reel on Tuesday. Meta does not know they searched your brand on Thursday. Each reports the part of the journey it observed.
The sequence is usually Meta then Google. Someone encounters you on social, remembers the name, and searches later. Google captures the click closest to the purchase and reports a clean, cheap acquisition. Meta reports the same buyer through view-through or an earlier click.
Which makes last-click systematically unfair to Meta and systematically flattering to Google — and it is why so many businesses conclude Meta does not work, cut it, and then watch Google’s performance quietly deteriorate over the following quarter.
Measuring properly, at your actual scale
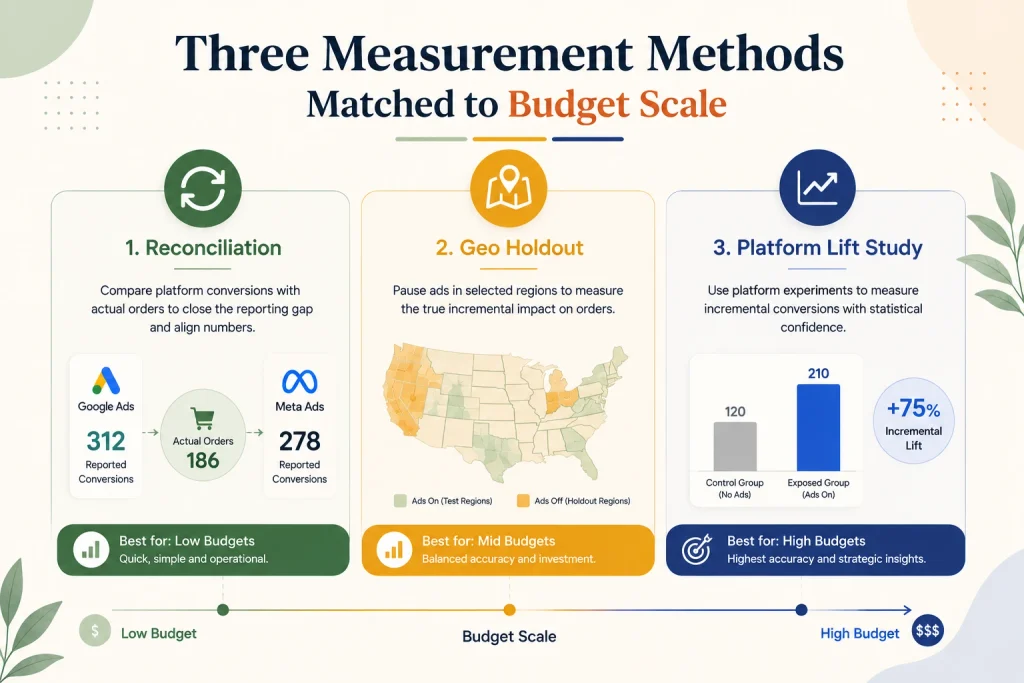
Three methods. The right one depends on how much volume you have, not on how sophisticated you want to appear.
Rung one: reconciliation
Cost: nothing. Works at any size.
The claim gap calculation above, run monthly. Platform-claimed conversions against actual recorded conversions.
It will not tell you which platform deserves credit. It will tell you how much of your combined reporting is duplicated, which is enough to stop you making a confident decision on numbers that are 35% inflated.
Add one refinement. Ask every new customer where they first heard of you and record it. Imperfect, self-reported, and still the only view you have of the pre-search half of the journey.
Rung two: geo holdout
Cost: some lost reach for a few weeks. Works for most mid-market advertisers.
Split India into two matched sets of regions with comparable historical performance. Run Meta in one set and switch it off in the other. Keep Google running everywhere. After three to four weeks, compare total conversions — from your own records, not from either platform — between the two sets.
The difference is Meta’s incremental contribution. Not its claimed contribution. Its actual one.
Design notes that matter. Match the regions on historical conversion volume, not population. Run for at least three weeks to capture delayed conversions. Change nothing else during the test. And accept that the result is a range rather than a number, because geography is never perfectly matched.
Why this is the practical choice. It needs no platform approval, no minimum audience size, and works with the data you already have. Google offers geo experiment tooling within Ads, and its open-source Meridian project extends geo experimentation into marketing mix modelling for larger advertisers — but the method works with a spreadsheet if it has to.
Rung three: platform lift studies
Cost: eligibility requirements most Indian mid-market advertisers cannot meet.
Meta’s Conversion Lift randomises users into a test group and a holdout who are not shown your ads. It is the cleanest available measurement because assignment is random at user level.
The constraint is scale. Reported requirements are around 200,000 users per group for adequate statistical power, running two to four weeks minimum.
For most Indian businesses reading this, that is not achievable, and there is no point structuring a measurement plan around a tool you cannot access. Rung two exists for exactly this reason.
How to actually split the budget
Once you can see something real, the split follows from three inputs.
Start from what a conversion is worth, not from a percentage. Your maximum acceptable cost per acquisition sets the ceiling on both platforms — working out what a conversion is actually worth covers the arithmetic.
Fund existing demand first. If people are searching for what you sell, capturing that is cheaper and faster than creating new demand. Google takes the first tranche and should be funded to the point where additional spend stops finding qualified searches — usually visible as impression share climbing while conversion rate falls.
Then fund demand creation with what remains, but only if it clears the platform’s own learning threshold. Splitting a remainder too thin across Meta produces an ad set that never stabilises, which is the failure mode covered in whether you can afford both platforms yet.
Shift in increments, not steps. Move 10–20% of budget and hold for a full learning period before judging. Anything larger restarts learning on both sides and destroys the comparison you were trying to make.
Re-run the claim gap quarterly. If it rises after a budget shift, your platforms are increasingly reaching the same people, and the marginal rupee is buying overlap rather than reach.
Mistakes that cost real money
Adding platform-reported conversions together. The error this article exists for.
Cutting Meta because Google’s CPA looks better. Last-click credits the platform closest to the purchase. That is a measurement artefact, not a performance verdict.
Running a geo test for ten days. Delayed conversions mean short tests measure noise.
Changing creative, budget and structure during a holdout. The test now measures nothing.
Matching test regions by population. Match on historical conversion volume, or the comparison is invalid before it starts.
Waiting for perfect measurement. Around half of marketers run no incrementality testing at all. A rough geo holdout beats a perfect plan that never runs.
When not to bother with any of this
When you are still below one platform’s learning threshold. Fix that first; there is nothing to split.
When your conversion volume is too low for a holdout to detect anything. With thirty conversions a month, normal variation swamps any effect you could measure. Use the claim gap and self-reported attribution, and accept the limits.
When your sales cycle exceeds the test window. A four-month B2B cycle cannot be measured in a three-week holdout. Longer-horizon methods or self-reported attribution are the honest options.
When one platform is clearly failing on its own terms. If a platform cannot produce qualified outcomes at any cost, incrementality is not the question.
The measurement and split checklist
☐ Platform-claimed conversions totalled for the same date range
☐ Actual conversions recorded from your own system, same range
☐ Claim gap calculated — claimed divided by actual
☐ “Where did you first hear of us” recorded for every new customer
☐ Maximum acceptable cost per acquisition established from margin
☐ Google funded to the point of diminishing qualified search volume
☐ Remaining budget checked against Meta’s learning threshold before splitting
☐ Geo holdout designed with regions matched on historical conversions
☐ Test window set at three weeks minimum
☐ Nothing else changed during the test window
☐ Budget shifts limited to 10–20% per move
☐ Claim gap re-run quarterly and after every significant shift
Questions we get asked
Should I run Google and Facebook ads at the same time?
Only once each can be funded past its own learning threshold. Below that, running both means neither stabilises — covered fully in whether you can afford both platforms yet.
How do I split budget between them?
Fund existing demand first, then demand creation with what remains, and move in increments of 10–20%. There is no universal ratio, and any article giving one is guessing at your category.
Why do my conversions not add up?
Because both platforms claim the same buyer under different attribution rules. The claim gap tells you by how much.
Which platform actually deserves credit?
Usually both, in different proportions than either reports. Only a holdout test answers it properly, and only for the period tested.
What is incrementality testing?
Measuring what would have happened without the ads, rather than what the ads claim. A holdout group is the simplest form.
Is a geo holdout accurate?
Accurate enough to change a decision, which is the standard that matters. It gives a range rather than a precise figure, and a range you trust beats a precise number you do not.
The calculation to run today
Open both platforms, set the same date range, and add the conversions together. Then open your own order or CRM records for the identical period.
Divide the first number by the second.
If the answer is comfortably above 1.0 — and for most advertisers running both platforms it will be — then every cost per acquisition you have been comparing, every budget decision you have made between the two, has been made on numbers that overlap by an amount you had not measured.
That calculation takes ten minutes and it is the prerequisite for everything else in this article.
If you would like the gap measured properly, a holdout designed around your actual volume, and an honest read on which platform is doing the work, you can reach out to us on whatsapp at +91 7738844851 .
More in Blog
Keep reading
All articles →


Ready to talk about your growth?
Tell us what's stuck and we'll tell you what we'd do first. Free, 30 minutes, no pitch.